Have you ever wondered about the intricate connections within EPFL’s associations? How do associations interconnect? How many accreditations does individuals have?
Let’s create an interactive visualization to show the relationships between associations and individuals with their accreditations!
- Retrieve the list of associations
- Retrieve the list of people in a unit
- Compute unit and user sizes
- Compute links between units and users
- Visualize with D3.js
- Conclusion
Retrieve the list of associations
After some research on the EPFL website, I found the search-ai.epfl.ch API. It allows you to search for units and people. The API is not publicly documented, but we just need to use one endpoint to retrieve the list of subunits of a unit:
https://search-api.epfl.ch/api/unit?hl=en&showall=0&siteSearch=unit.epfl.ch&acro={UNIT_ACRONYM}
For example, to retrieve the list of subunits of the ASSOCIATIONS unit, we can use the following URL:
curl "https://search-api.epfl.ch/api/unit?hl=en&showall=0&siteSearch=unit.epfl.ch&acro=ASSOCIATIONS"
We obtain the following response:
{
    "code": 10583,
    "acronym": "ASSOCIATIONS",
    "name": "Associations on the campus",
    "unitPath": "EHE ASSOCIATIONS",
    "path": [
        {
            "acronym": "EHE",
            "name": "New structure of the entities except school"
        },
        {
            "acronym": "ASSOCIATIONS",
            "name": "Associations on the campus"
        }
    ],
    "terminal": null,
    "ghost": null,
    "url": "https://associations.epfl.ch",
    "subunits": [
        {
            "acronym": "AGEPOLY-CE",
            "name": "AGEPoly - Commissions et \u00e9quipes"
        },
        {
            "acronym": "AIDE-PROF",
            "name": "Aide \u00e0 la vie professionnelle"
        },
        {
            "acronym": "ANIMATIONS",
            "name": "Animations"
        },
        {
            "acronym": "AUTRES-ASS",
            "name": "Autres associations"
        },
        {
            "acronym": "DEVELOP",
            "name": "D\u00e9veloppement"
        },
        {
            "acronym": "ETUD-PAYS",
            "name": "Etudiants - Pays"
        },
        {
            "acronym": "ETUD-EPFL",
            "name": "Etudiants EPFL"
        },
        {
            "acronym": "PROJETS-INT",
            "name": "Projets interdisciplinaires"
        },
        {
            "acronym": "4-CORPS",
            "name": "Representation of the 4 school bodies and ACC-EPFL"
        },
        {
            "acronym": "REPRESENT",
            "name": "Repr\u00e9sentation des \u00e9tudiants"
        },
        {
            "acronym": "SCIENC-CULT",
            "name": "Sciences et cultures"
        },
        {
            "acronym": "SPORTS",
            "name": "Sports"
        }
    ]
}
We can see there are 12 “group” units for ASSOCIATIONS. Now querying the same endpoint with the acronym of one of the “group”, for example ANIMATIONS:
curl "https://search-api.epfl.ch/api/unit?hl=en&showall=0&siteSearch=unit.epfl.ch&acro=ANIMATIONS"
We obtain the following response:
{
    "code": 11438,
    "acronym": "ANIMATIONS",
    "name": "Animations",
    "unitPath": "EHE ASSOCIATIONS ANIMATIONS",
    "path": [
        {
            "acronym": "EHE",
            "name": "New structure of the entities except school"
        },
        {
            "acronym": "ASSOCIATIONS",
            "name": "Associations on the campus"
        },
        {
            "acronym": "ANIMATIONS",
            "name": "Animations"
        }
    ],
    "terminal": null,
    "ghost": null,
    "address": [
        "CH-"
    ],
    "head": {
        "sciper": "220390",
        "name": "Traill",
        "firstname": "Heidy",
        "email": "heidy.traill@epfl.ch",
        "profile": "heidy.traill"
    },
    "subunits": [
        {
            "acronym": "ARTIPHYS",
            "name": "Artiphys"
        },
        {
            "acronym": "BALELEC",
            "name": "Festival Bal\u00e9lec"
        },
        {
            "acronym": "SYSMIC",
            "name": "Festival SYSMIC"
        },
        {
            "acronym": "AS-SATELLITE",
            "name": "Satellite"
        }
    ]
}
We now have associations units as subunits. We can thus create a script that retrieves the list of subunits of the ASSOCIATIONS unit, and then the list of subunits of each subunit, and so on until we have the list of all associations.
import requests
import json

def list_units(write_groups_json=True, write_units_json=True):
    BASE_URL = "https://search-api.epfl.ch/api/unit?hl=en&showall=0&siteSearch=unit.epfl.ch&acro="

    res = requests.get(BASE_URL + 'ASSOCIATIONS')
    groups = json.loads(res.text)['subunits']

    units = []
    for i, group in enumerate(groups):
        res = requests.get(BASE_URL + group['acronym'])

        # Find child units of the group
        child_units = json.loads(res.text)['subunits']

        # Add id to groups
        groups[i] = {
            **group,
            'id': i
        }
        for unit in child_units:
            units.append({
                'group_name': group['acronym'],
                'group_id': i,
                **unit
            })

    # Add id and type to units
    for i, unit in enumerate(units):
        units[i] = {
            **unit,
            'id': i,
            'label': unit['acronym'],
            'type': 'unit'
        }

    return units, groups
Retrieve the list of people in a unit
Now that we have the list of subunits, we have to retrieve the list of people in each subunit. Let’s test the same endpoint as before with the SYSMIC accronym:
curl "https://search-api.epfl.ch/api/unit?hl=en&showall=0&siteSearch=unit.epfl.ch&acro=SYSMIC"
We get the response:
{
    "code": 11346,
    "acronym": "SYSMIC",
    "name": "Festival SYSMIC",
    "unitPath": "EHE ASSOCIATIONS ANIMATIONS SYSMIC",
    "path": [
        {
            "acronym": "EHE",
            "name": "New structure of the entities except school"
        },
        {
            "acronym": "ASSOCIATIONS",
            "name": "Associations on the campus"
        },
        {
            "acronym": "ANIMATIONS",
            "name": "Animations"
        },
        {
            "acronym": "SYSMIC",
            "name": "Festival SYSMIC"
        }
    ],
    "terminal": "1",
    "ghost": null,
    "address": [
        "Festival SYSMIC",
        "P.a. EPFL STI SMT-GE",
        "BM 2107 (B\u00e2timent BM)",
        "Station 17",
        "CH-1015 Lausanne"
    ],
    "head": {
        "sciper": "324926",
        "name": "Cirillo",
        "firstname": "Thomas",
        "email": "thomas.cirillo@epfl.ch",
        "profile": "thomas.cirillo"
    },
    "url": "https://sysmic.epfl.ch",
    "people": [
        {
            "name": "Artru",
            "firstname": "Thomas",
            "email": "thomas.artru@epfl.ch",
            "sciper": "329649",
            "rank": 0,
            "profile": "thomas.artru",
            "position": "Vice-President of Association",
            "phoneList": [

            ],
            "officeList": [

            ]
        },
        {
            "name": "Charoz\u00e9",
            "firstname": "Rapha\u00ebl Guillaume Alexandre",
            "email": "raphael.charoze@epfl.ch",
            "sciper": "330682",
            "rank": 0,
            "profile": "raphael.charoze",
            "position": "Vice-President of Association",
            "phoneList": [

            ],
            "officeList": [

            ]
        },
        {
            "name": "Cirillo",
            "firstname": "Thomas",
            "email": "thomas.cirillo@epfl.ch",
            "sciper": "324926",
            "rank": 0,
            "profile": "thomas.cirillo",
            "position": "President of Association",
            "phoneList": [

            ],
            "officeList": [

            ]
        },
        {
            "name": "D\u00e9vaud",
            "firstname": "S\u00e9bastien Andr\u00e9",
            "email": "sebastien.devaud@epfl.ch",
            "sciper": "315144",
            "rank": 0,
            "profile": "sebastien.devaud",
            "position": "Treasurer",
            "phoneList": [

            ],
            "officeList": [

            ]
        },
        {
            "name": "Hakim",
            "firstname": "Daoud",
            "email": null,
            "sciper": "330002",
            "rank": 0,
            "profile": "330002",
            "position": "Vice-President of Association",
            "phoneList": [

            ],
            "officeList": [

            ]
        }
    ]
}
The people field contains the list of people in the subunit that is displayed on the people.epfl.ch page of the unit.
Unfortunately, for SYSMIC and other subunits it only contains certain members of the subunit. To retrieve the full list of members, we have to use the internal EPFL LDAP server.
The EPFL LDAP server is an internal server that contains the list of all EPFL people. It is not publicly accessible, but we can use the EPFL VPN to access it. The LDAP server is not documented, but it follows the LDAP protocol and we can use the ldap3 Python library to connect to and query from it.
Here is a script that retrieves the list of accreditations in a subunit from the LDAP server, for all units:
from ldap3 import Server, Connection, SUBTREE

def list_accreds(units):
    '''
    List all accreditations of EPFL from the LDAP server of EPFL (ldap.epfl.ch).

    Input:
        units (list): list of units
        write_accreds_json (bool): write accreditations to accreds.json (optional)

    Output:
        accreds.json (file): list of accreditations (optional)

    Return:
        accreds (list): list of accreditations
    '''

    server = Server('ldaps://ldap.epfl.ch:636', connect_timeout=5)
    c = Connection(server)

    if not c.bind():
        print("Error: could not connect to ldap.epfl.ch", c.result)
        return

    accreds = []
    for unit in units:
        c.search(search_base = 'o=ehe,c=ch',
                search_filter = f"(&(ou={unit['acronym']})(objectClass=person))",
                search_scope = SUBTREE,
                attributes = '*')

        results = c.response
        for user in results:
            user = dict(user['attributes'])
            accreds.append({
                'sciper': int(user['uniqueIdentifier'][0]),
                'name': user['displayName'],
                'unit_name': unit['acronym'],
                'unit_id': unit['id']
            })

    return accreds
Compute unit and user sizes
Now that we have the list of accreditations, we can compute the size of each unit and each user. The size of a unit is the number of accreditations in the unit. The size of a user is the number of accreditations of the user.
def compute_units_size(units, accreds):
    units_size = dict()
    for accred in accreds:
        unit_id = accred['unit_id']
        if unit_id in units_size:
            units_size[unit_id] += 1
        else:
            units_size[unit_id] = 1

    for i, unit in enumerate(units):
        if unit['id'] not in units_size:
            size = 0
        else:
            size = units_size[unit['id']]
        units[i] = {
            **unit,
            'size': size
        }

    return units
def compute_users_size(accreds):
    n_accreds = dict()
    for accred in accreds:
        if (accred['sciper'] in n_accreds):
            n_accreds[accred['sciper']] += 1
        else:
            n_accreds[accred['sciper']] = 1

    users = []
    for accred in accreds:
        if (n_accreds[accred['sciper']] > 1):
            user = {
                'id': accred['sciper'],
                'name': accred['name'],
                'type': 'user',
                'accreds': n_accreds[accred['sciper']]
            }
            if (user not in users):
                users.append(user)

    return users
Compute links between units and users
Now that we have the list of accreditations, we can compute the links between units and users. A link between a unit and a user means that the user has an accreditation in the unit.
def compute_links(accreds, units, users):
    links = []
    for i, accred in enumerate(accreds):
        for unit in units:
            if (unit['acronym'] == accred['unit_name']):
                unit_id = unit['id']

        for user in users:
            if (user['id'] == accred['sciper']):
                user_id = user['id']
                links.append({
                    'target': unit_id,
                    'source': user_id
                })

    return links
Visualize with D3.js
Now that we have the list of units, users, and links, we can visualize it with D3.js. The visualization is based on the D3.js Force-Directed Graph example.
First we have to write the data to a JSON file:
def write_json(units, users, links, groups):

    data = {
        'nodes': units + users,
        'links': links
    }

    with open("data.json", "w", encoding='utf8') as outfile:
        json.dump(data, outfile, ensure_ascii=False)

    with open("groups.json", "w", encoding='utf8') as outfile:
        json.dump(groups, outfile, ensure_ascii=False)
Then we can use the following HTML template to visualize the data:
<!-- index.html -->
<!DOCTYPE html>
<html lang="en">

<head>
    <meta charset="UTF-8">
    <meta name="description" content="Graphsociatif">
    <meta name="keywords" content="graph,associations,EPFL">
    <meta name="author" content="Antonin Faure">
    <meta name="viewport" content="width=device-width, initial-scale=1, shrink-to-fit=no">
    <title>Graphsociatif</title>

    <!-- JQuery -->
    <script src="https://code.jquery.com/jquery-3.4.1.min.js"></script>

    <!-- D3.js -->
    <script src="https://d3js.org/d3.v4.min.js"></script>
</head>

<body>
    <svg id="mynetwork"></svg>
</body>

<style>
    html, body {
        min-height: 100%;
        height: 100%;
        min-width: 100%;
        margin: 0;
        padding: 0;
        background-color: black;
    }
    #mynetwork {
        width: 100%;
        min-height: 600px;
        border: 1px solid lightgray;
        height: 100%;
    }
</style>


<!-- Our custom script -->
<script type="module" src="network.js"></script>

</html>
Now we can write the network.js script that will load the data and visualize it with D3.js.
We have to differentiate between units and users, and we have to differentiate between links between units and links between users.
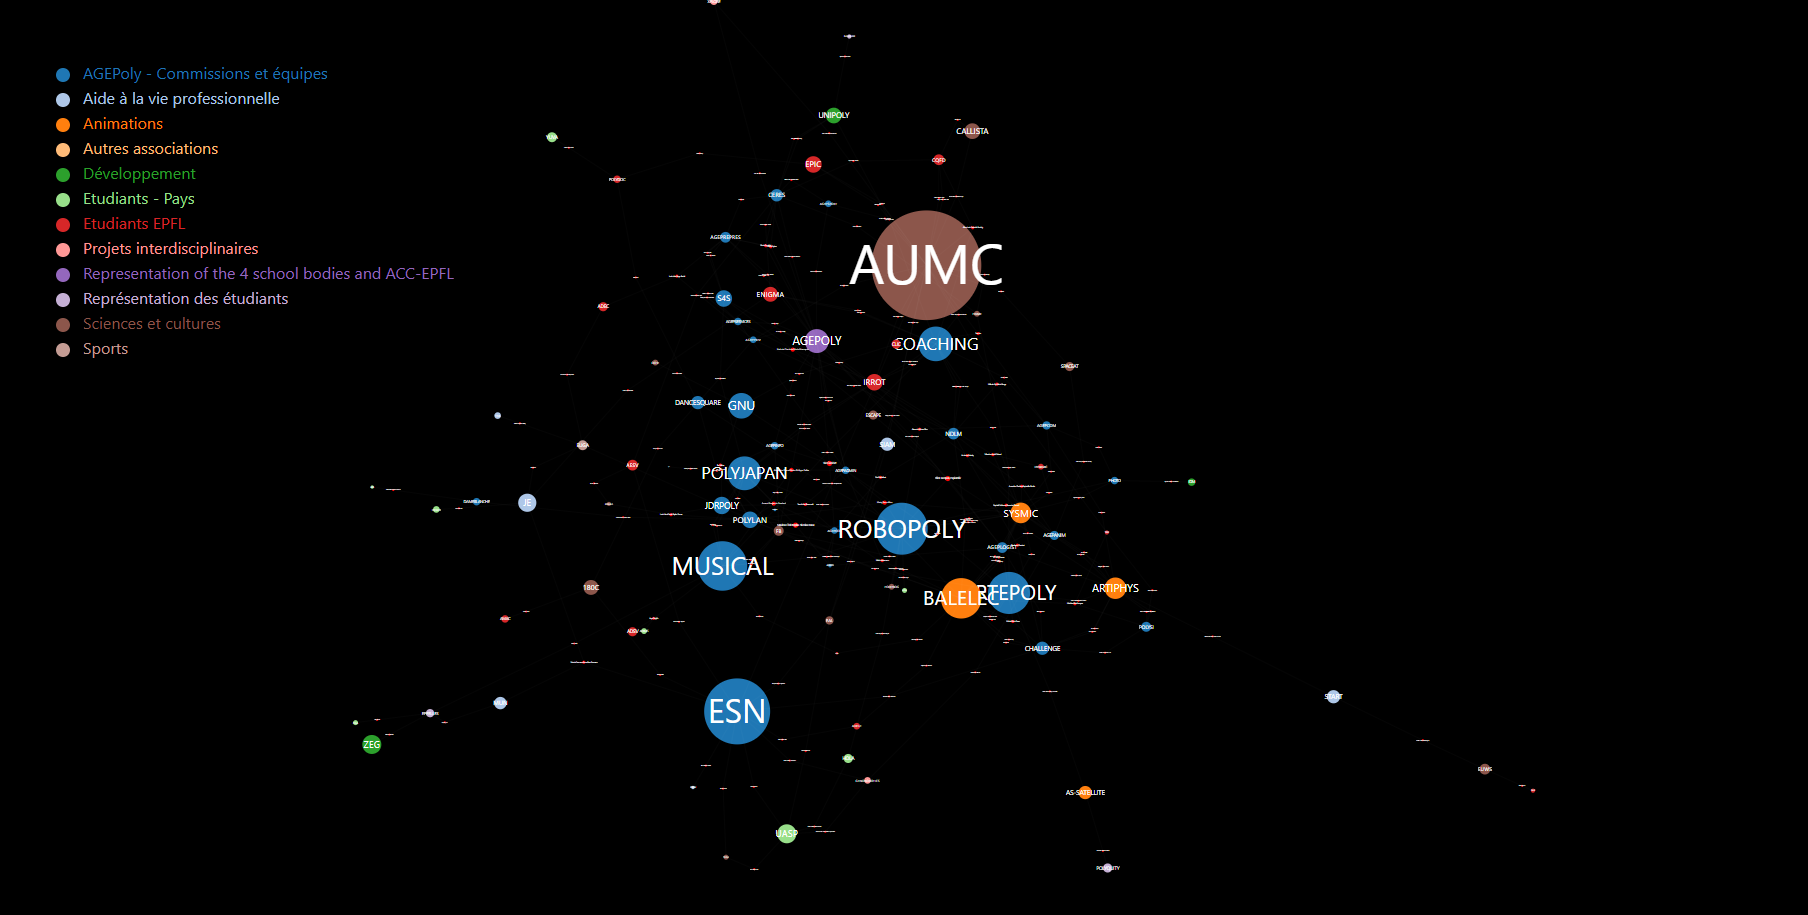
For the user nodes we’ll set the color to red, and the radius to the number of accreditations of the user. For the unit nodes we’ll set the color to the color of the group of the unit, and the radius to the number of accreditations in the unit. We’ll also create a legend to show each group with its name and color.
// network.js

fetch("groups.json")
  .then(response => {
    return response.json();
  })
  .then(groups => {
    fetch("data.json")
      .then(response => {
        return response.json();
      })
      .then(graph => {

        // Dimensions of the SVG canvas
        const width = window.innerWidth
        const height = window.innerHeight

        // Select the SVG element and set its dimensions
        const svg = d3.select('svg')
          .attr('width', width)
          .attr('height', height)

        // Color scale for units
        var color = d3.scaleOrdinal(d3.schemeCategory20);

        // Node radius constants
        const radius = 20
        const radius_people = 25

        // Create a force simulation
        var simulation = d3.forceSimulation()
          .force("link", d3.forceLink().id(function (d) { return d.id; }))
          .force("charge", d3.forceManyBody())
          .force("center", d3.forceCenter(width / 2, height / 2))
          .force("collide", d3.forceCollide().radius(d => { return d.type === 'user' ? 50 * radius_people : 100 * radius }).iterations(3))

        // Append an SVG group for elements
        var g = svg.append("g")
          .attr("class", "everything");

        // Create nodes using data from graph.nodes
        var node = g.append("g")
          .attr("class", "nodes")
          .selectAll("g")
          .data(graph.nodes)
          .enter().append("g")

        // Create links using data from graph.links
        var link = g.append("g")
          .attr("class", "links")
          .selectAll("line")
          .data(graph.links)
          .enter().append("line")
          .attr("stroke-width", function (d) { return Math.sqrt(d.value); })
          .style('stroke', 'white')

        // Create circles for nodes
        var circles = node.append("circle")
          .attr("r", function (d) {
            return d.type === 'user' ? d.accreds * radius_people : d.size * radius
          })
          .attr("fill", function (d) {
            if (d.type == 'unit') {
              return color(d.group_id);
            } else {
              return 'red'
            }
          })

        // Create a drag handler and append it to the node object instead
        var drag_handler = d3.drag()
          .on("start", dragstarted)
          .on("drag", dragged)
          .on("end", dragended);

        drag_handler(node);

        // Add labels to nodes
        var labels = node.append("text")
          .attr("text-anchor", "middle")
          .attr("dy", ".35em")
          .text(function (d) {
            return d.type === 'user' ? d.name : d.label
          })
          .style("font-size", function (d) {
            return d.type === 'user' ? d.accreds * radius_people : d.size * radius
          })
          .style('fill', 'white')

        // Add tooltips to nodes
        node.append("title")
          .text(function (d) { return d.type === 'user' ? d.name : d.label });

        // Initialize the simulation with nodes and links
        simulation
          .nodes(graph.nodes)
          .on("tick", ticked);

        simulation.force("link")
          .links(graph.links);

        // Function to update link and node positions during simulation
        function ticked() {
          link
            .attr("x1", function (d) { return d.source.x; })
            .attr("y1", function (d) { return d.source.y; })
            .attr("x2", function (d) { return d.target.x; })
            .attr("y2", function (d) { return d.target.y; });

          node
            .attr("transform", function (d) {
              return "translate(" + d.x + "," + d.y + ")";
            })

        }

        // Functions for drag interactions
        function dragstarted(d) {
          if (!d3.event.active) simulation.alphaTarget(0.3).restart();
          d.fx = d.x;
          d.fy = d.y;
        }

        function dragged(d) {
          d.fx = d3.event.x;
          d.fy = d3.event.y;
        }

        function dragended(d) {
          if (!d3.event.active) simulation.alphaTarget(0);
          d.fx = null;
          d.fy = null;
        }


        // Add zoom capabilities
        var zoom_handler = d3.zoom()
          .on("zoom", zoom_actions);

        zoom_handler(svg);

        function zoom_actions() {
          g.attr("transform", d3.event.transform)
        }

        // Add legend for units (dot + name)
        svg.selectAll("mydots")
          .data(groups)
          .enter()
          .append("circle")
          .attr("cx", 100)
          .attr("cy", function (d, i) { return 100 + i * 25 }) // 100 is where the first dot appears. 25 is the distance between dots
          .attr("r", 7)
          .style("fill", function (d) { return color(d.id) })

        svg.selectAll("mylabels")
          .data(groups)
          .enter()
          .append("text")
          .attr("x", 120)
          .attr("y", function (d, i) { return 100 + i * 25 }) // 100 is where the first dot appears. 25 is the distance between dots
          .style("fill", function (d) { return color(d.id) })
          .text(function (d) { return d.name })
          .attr("text-anchor", "left")
          .style("alignment-baseline", "middle")

      })
  })
The visualization is now complete! We can now open the index.html file in a browser and see the visualization (we have to run a local server to load the data with fetch).
For customizing the visualization, we can change the color scale, the radius of the nodes, the force simulation parameters, etc in the network.js file.
Conclusion
We have seen how to retrieve the list of associations and the list of accreditations from the EPFL LDAP server, and how to visualize it with D3.js. The visualization is available here: Demo
The code is available on GitHub.
For future projects it could be interesting to extend the graph to all units of EPFL, and to add more information about the accreditations (e.g. the role of the user in the unit).